Data Quality Management Procedure 📊
QALITA Platform places data quality management at the center 🎯 of its operations. This management is ensured and facilitated by a set of features that allow you to:
- Measure data quality 📏 and create analysis reports.
- Detect anomalies 🔍 and translate them into actions.
- Take corrective actions 🔧 and track their execution, measure their impact.
Data Management Procedure
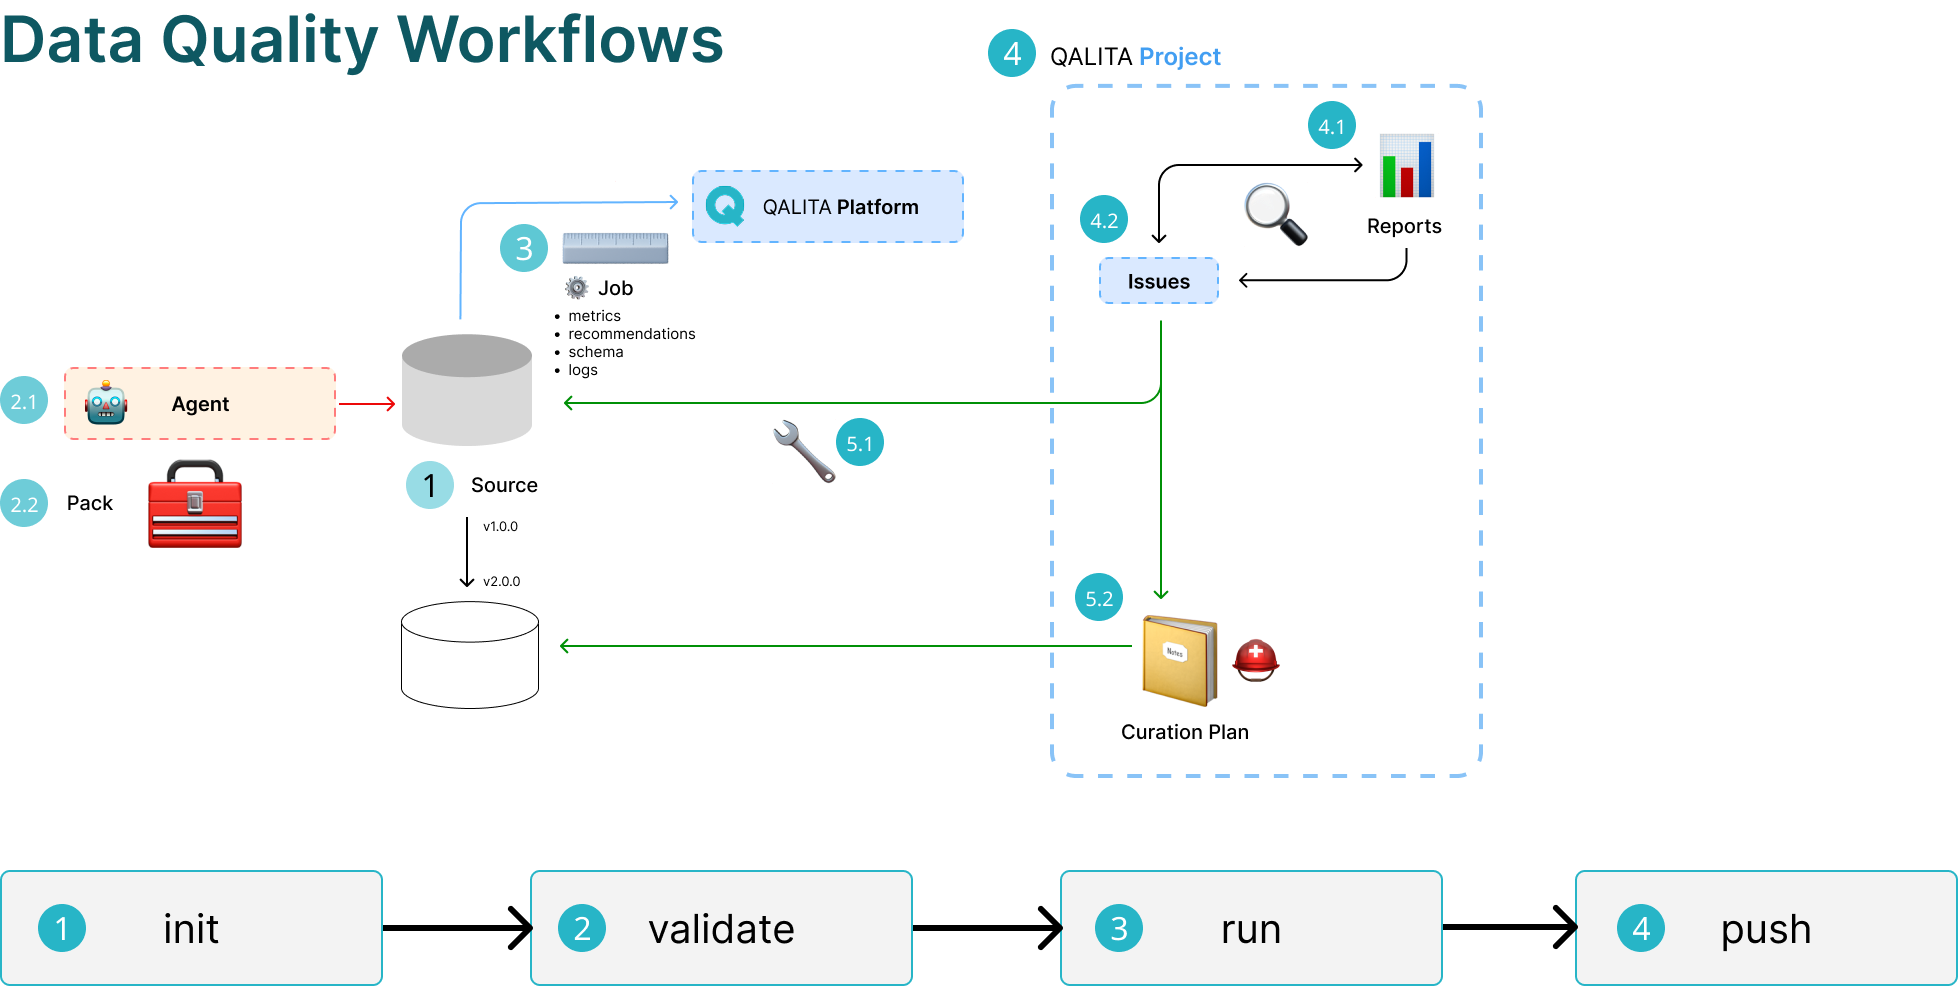
Measuring Data Quality (1/2/3) 📈
1. Source
The first step is to reference the source to be measured in the platform.
This step is performed by a data engineer using the command line qalita-cli.
2.1 Agent
The second step is to register an agent capable of communicating with the source.
This step is also performed by a data engineer using the command line qalita-cli.
2.2 Pack
Next, you need to create a pack for measuring data quality.
This step is also performed by a data engineer or a data analyst using the command line qalita-cli.
Packs are categorized based on the type of analysis they produce, for example: pack:quality:completeness to measure data completeness.
QALITA Platform provides a set of default packs, but it is possible to create new ones.
QALITA Platform supports packs of the following types:
completeness: Measures data completeness.validity: Measures data validity.accuracy: Measures data accuracy.timeliness: Measures data timeliness.consistency: Measures data consistency.uniqueness: Measures data uniqueness.reasonability: Measures data reasonability.
3. Analysis
The final step is to run an analysis on the source. This step is performed by a data engineer using the command line qalita-cli. The analysis is performed using a pack and an agent. It produces metadata that is stored in the QALITA Platform database.
- metrics: Metrics are data quality indicators. They are calculated by the packs from the source data.
- recommendations: Recommendations are suggestions for improvement identified during the analysis of the source by the pack.
- schema: The schema describes the structure of the data. This allows metrics and recommendations to be associated with data
scopes. - logs: Logs are the traces of the analysis. They help understand the calculations performed by the pack.
Detecting Anomalies (4) 🔎
Anomalies are detected by a data analyst or a data manager using the QALITA Platform graphical interface. Anomalies are detected from the metrics and recommendations produced by the analyses. They are then associated with a ticket.
4. Projects
To facilitate better organization, it is possible to create projects that group sources and analyses.
A project includes:
- One or more data sources referenced in the platform.
- Data quality analysis reports.
- Tickets associated with the project's data sources.
- Data curation plans.
This can be particularly useful for data migration projects or research projects involving multiple data sources.
4.1 Reports
Reports are documents that allow you to visualize the metadata of sources linked to a project.
They are generated by QALITA Platform and can be configured to display the metrics and recommendations of one or more packs on one or more sources. They are also shareable, facilitating information sharing and collaboration among different project stakeholders.
See the Reports page for more information
4.2 Tickets
Tickets are anomalies detected by a data analyst or a data manager. They are associated with a data source and created from the metrics and recommendations of the analysis reports.
Recommendations are categorized based on their criticality:
- High: The data is unusable.
- Warning: The data is usable but with risks.
- Info: The data is usable but with limited risks.
Tickets allow you to track anomalies and associated corrective actions. They can be managed directly from the platform or from a project management tool like Jira or Trello through QALITA Platform integration with these tools.
Corrective Actions (5) 🛠️
There are two types of possible anomalies:
- The anomaly is human-related (e.g., incorrect input, misconfiguration). The data is incorrect at the source and needs to be corrected.
- The anomaly is due to a technical issue. The data is incorrect after transformation and needs to be transformed, excluded, or the ETL programs need to be corrected.
5.1 Technical
If the anomaly is technical, QALITA Platform does not correct it directly. You need to correct the ETL program that caused the anomaly. This can be done by a data engineer. However, the tracking of the correction can be managed by a data analyst or a data manager using tickets. Then, a new analysis can be run to verify that the correction has been properly implemented.
5.2 Human
If the anomaly is human-related, QALITA Platform allows you to correct it directly.
To do this, you need to create a data curation plan. A curation plan is a set of corrective actions that address an anomaly. It is created by a data analyst or a data manager using the QALITA Platform graphical interface.
The original source is copied, and then the corrective actions are applied to the copy. This preserves the original source intact. A new version of the source is created, which is then analyzed to verify that the corrective actions have been properly implemented.
This feature is currently under development. It is expected to be available by the end of 2025.